Note 06 · Terrain / Contours
Contour spacing and slope
How far apart the lines sit is a measurement, not an impression. A small lookup table turns millimetres on the map into degrees on the ground.
Closely packed contours mean steep ground; widely spaced ones mean gentle ground. Everyone who has used a map knows that much. The step from impression to number is short, and worth taking once.
The arithmetic
Two neighbouring contours differ in height by the contour interval. The gap between them on the map, multiplied by the scale, is the horizontal distance on the ground. Height over distance is the gradient, and the angle follows:
The formula
Slope angle = arctan (contour interval ÷ ground distance between contours)
On a 1:25 000 map one millimetre stands for 25 metres. With a 10 m interval, lines one millimetre apart mean 10 m of rise in 25 m of travel: a gradient of 40 per cent, or just under 22 degrees.
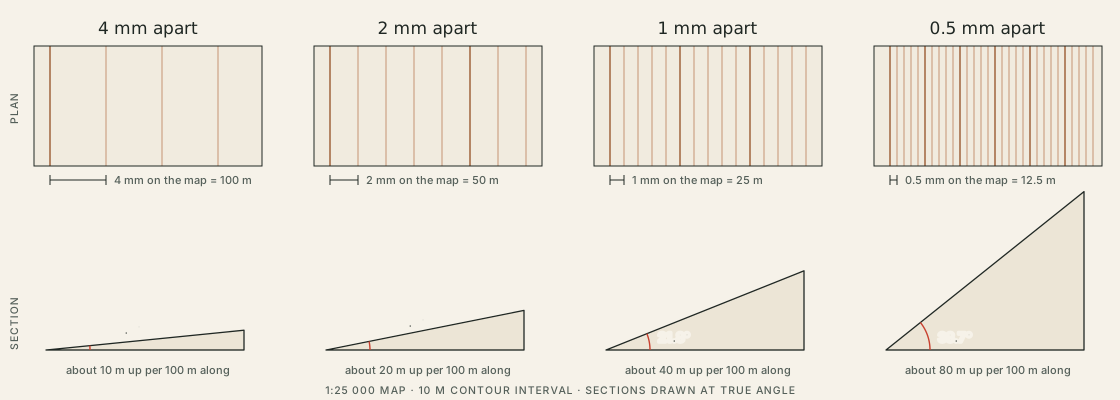
A lookup table
| Gap on the map | Ground distance | Gradient | Slope angle |
|---|---|---|---|
| 10 mm | 250 m | 4% | 2.3° |
| 5 mm | 125 m | 8% | 4.6° |
| 4 mm | 100 m | 10% | 5.7° |
| 3 mm | 75 m | 13% | 7.6° |
| 2 mm | 50 m | 20% | 11.3° |
| 1.5 mm | 37.5 m | 27% | 14.9° |
| 1 mm | 25 m | 40% | 21.8° |
| 0.5 mm | 12.5 m | 80% | 38.7° |
The table is not linear. Halving the gap from 4 mm to 2 mm doubles the gradient and roughly doubles the angle; halving it again from 1 mm to 0.5 mm adds seventeen degrees. Small changes in spacing matter most where the lines are already tight.
A quicker measure for a whole leg
For planning, the average slope of a leg is often enough, and it needs no ruler: metres climbed, divided by the leg’s length in metres, is the gradient.
| Leg | Height change | Distance | Average gradient | Average angle | Steepest 100 m | As an angle |
|---|---|---|---|---|---|---|
| S–1 | +215 m | 1.8 km | 12% | 6.8° | 17% | 9.4° |
| 1–2 | +120 m | 1.0 km | 12% | 6.8° | 17% | 9.5° |
| 2–3 | −85 m | 1.2 km | 7% | 4.1° | 10% | 6.0° |
| 3–4 | +50 m | 0.7 km | 7% | 4.1° | 11% | 6.1° |
| 4–5 | −240 m | 2.1 km | 11% | 6.5° | 15% | 8.4° |
| 5–6 | −50 m | 0.8 km | 6% | 3.6° | 11% | 6.3° |
By the average, the sample loop is moderate throughout: no leg averages more than seven degrees.
What an average hides
An average is a straight line drawn from one end of a leg to the other. The ground between is rarely straight. Leg S–1 averages 12 per cent, but its first 600 m, across the valley floor to the foot of the spur, rise less than 30 m. The rest of the leg has to make up the difference and climbs at nearly 16 per cent, with its steepest hundred metres at 17. On the map that shows as wide gaps beside the brook and a tight band of lines above them.
So the two measures do different jobs. The leg average says how much effort a stretch will take and feeds the time estimate. The contour gap, read at the tightest place on the leg, says how steep the steepest part is — and that is the number that decides whether a line is comfortable.