Note 08 · Terrain / Route Reading
Reading a profile
A route seen side-on shows where the effort falls. It also exaggerates, and leaves out nearly everything else.
A map shows a route from above. A profile shows it from the side: height against distance, as if the line had been pulled straight and the hill sliced along it. The two views answer different questions, and the profile’s question is a narrow one — where does the effort fall?
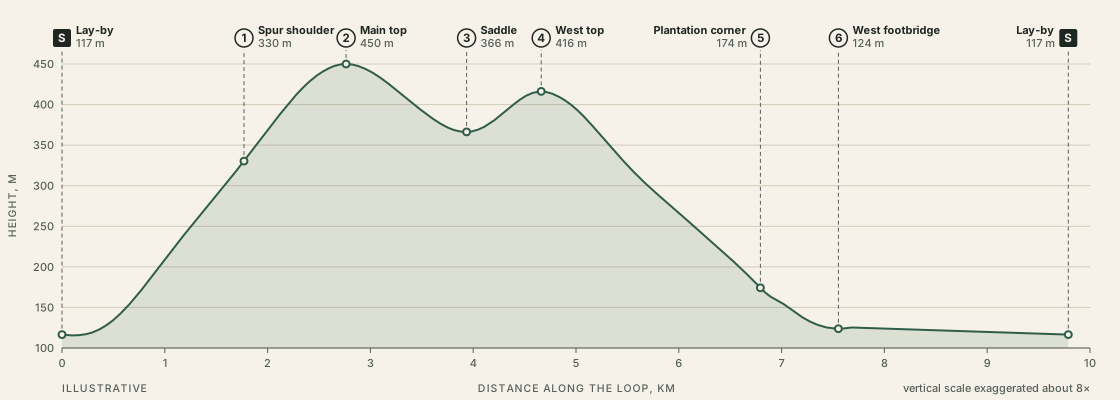
Three questions to put to any profile
| Question | On the sample loop | Why it matters |
|---|---|---|
| Where is most of the climbing? | In the first 2.8 km: 335 m of the loop’s 385 m | The hard part comes first, while legs are fresh and the whole window is still ahead |
| Where is the high point, by time? | Main top at T+1:07 of 2 h 35 moving | 29% of the distance but 43% of the time |
| What does the last hour look like? | From about T+1:35: all descent, then 2.2 km of level lane | Little effort, and a line that is easy to follow when tired |
The second row is the one a map hides. Measured along the ground, the main top is less than a third of the way round. Measured in effort, it is nearly half-way. Anyone judging progress by distance alone will feel behind on the climb and then be surprised by how quickly the rest goes.
The numbers behind the picture
| Leg | From | To | km | Climb, m | Drop, m | Estimate | Running total | Height at end, m |
|---|---|---|---|---|---|---|---|---|
| S–1 | Lay-by on the lane | Spur shoulder | 1.8 | 215 | 0 | 43 min | T+0:43 | 330 |
| 1–2 | Spur shoulder | Main top | 1.0 | 120 | 0 | 24 min | T+1:07 | 450 |
| 2–3 | Main top | Saddle | 1.2 | 0 | 85 | 14 min | T+1:21 | 366 |
| 3–4 | Saddle | West top | 0.7 | 50 | 0 | 13 min | T+1:34 | 416 |
| 4–5 | West top | Plantation corner | 2.1 | 0 | 240 | 25 min | T+1:59 | 174 |
| 5–6 | Plantation corner | West footbridge | 0.8 | 0 | 50 | 10 min | T+2:09 | 124 |
| 6–S | West footbridge | Lay-by on the lane | 2.2 | 0 | 10 | 26 min | T+2:35 | 117 |
| Whole loop | 9.8 | 385 | 385 | 2 h 35 | ||||
Measured on the invented height field behind Sheet 00. Estimate: 12 min per km + 10 min per 100 m of ascent, each leg rounded to the minute. Distances to 0.1 km, heights to 5 m.
Read against the chart, the table explains its shape. Legs S–1 and 1–2 are the long ramp on the left. Leg 2–3 is the dip to the saddle, and leg 3–4 is the 50 m that has to be climbed again to reach the west top. Leg 4–5 is the long fall to the plantation corner, and 6–S is the flat tail.
How the picture misleads
It exaggerates. The loop is nearly ten kilometres long and rises about a third of a kilometre. Drawn to a true scale it would be an almost flat line, so the vertical axis is stretched — on this chart about eight times. The first climb looks like a wall; its real average slope, from Note 06, is under seven degrees.
It smooths. A profile is only as detailed as the heights it was built from. Short steep steps between sample points vanish.
It has no sideways. Nothing in a profile says whether the ground is a broad spur or a narrow one, whether there is a path, or what lies to either side.
It says nothing about surface. The level 2.2 km of lane and a level 2.2 km of bog would draw as the same line.
Working rule
Use the profile to place the effort and to plan stops. Use the map for everything else.
Putting it to work
For a half-day, a profile earns its place in two decisions. The first is direction: this loop is drawn anticlockwise on the map, which puts the climb first. Walked the other way round, the same profile is read from right to left — a level start, a long steady climb to the west top and the steepest ground met on the way down.
The second is where to stop. The shape suggests the main top: the climbing is done, and what remains is known to be easier. That fits the budget, and it puts the longest halt just before the two places — the top and the saddle — where the check times are read.